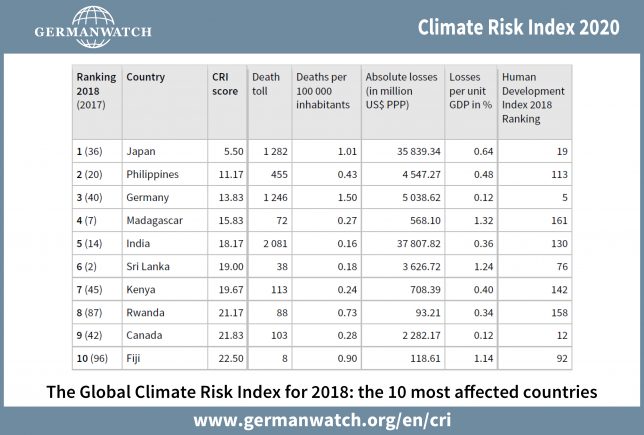
The Global Climate Risk Index by the environmental think tank Germanwatch shows that globally in the past 20 years, nearly 500,000 fatalities were directly linked to more than 12,000 extreme weather events. This amounted to approximately $3.54 trillion in economic damages.
The Climate Risk Index shows that climate change has disastrous impacts especially for poor countries, but also causes increasingly severe damages in industrialized countries like Japan or Germany.
–David Eckstein, Germanwatch

(C) www.germanwatch.org/en/cri
Impact Especially Tough on Poor Countries
During 1999 to 2018, poor countries faced much higher impacts. Seven of the ten countries most affected are developing countries with low or lower middle income per capita. Puerto Rico, Myanmar, and Haiti were most affected. The Philippines were hit by the most powerful typhoon recorded worldwide in 2018.
Countries like Haiti, Philippines and Pakistan are repeatedly hit by extreme weather events and have no time to fully recover. That underlines the importance of reliable financial support mechanisms for poor countries like these not only in climate change adaptation, but also for dealing with climate-induced loss and damage.
–David Eckstein, Germanwatch
Those who are least responsible for the problem, are the ones who are suffering the most. This is unacceptable.
–Renato Redentor Constantino, Executive Director, Institute for Climate and Sustainable Cities (Philippines)
Industrialized Countries Also Impacted
Among industrialized countries, in 2018, Japan and Germany were hit hardest by heat-waves and severe drought.
Heat Waves
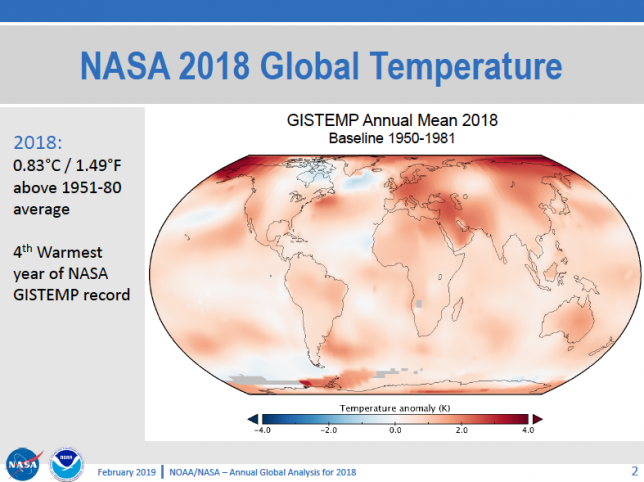
Science confirms the link between climate change and the frequency and severity of extreme heat.
Heat waves were one major cause of damage in 2018. Germany, Japan, and India suffered from extended periods of heat. Europe is now up to 100 times more likely than a century ago to experience extreme heat spells. The African continent heatwaves may be under-represented due to a lack of data.

