Reshaping Earth In Profound, Unsustainable Ways

In 2016, the world moved permanently above 400 parts per million. The 400 ppm milestone is a symbolic and necessary reminder that we, as humans, are reshaping Earth in profound and unsustainable ways.

The Keeling Curve, named for scientist Charles David Keeling, is a graph that shows the accumulation of carbon dioxide in the Earth’s atmosphere based on continuous measurements taken at the Mauna Loa Observatory in Hawaii. Keeling’s measurements showed the first significant evidence of rapidly increasing carbon dioxide (CO2) levels in the atmosphere.

NASA, with its carbon monitoring system, shows the amount of CO2 in the atmosphere decreases in the spring and summer. In spring and summer, plants in the oceans and on land pull carbon dioxide out of the atmosphere. In the fall and winter, CO2 increases because plants and animals release the carbon dioxide that captured during the growing season.

Since the Industrial Revolution, we’ve been burning fossil fuels (coal, oil, or natural gas) for energy. Fuels release into the atmosphere significantly faster than the plants in the oceans and on the land can take out the CO2. This is moving the Keeling curve up.

Scientists In Antarctica Study Effects Of Climate Change

At the German research facility Neumayer Station III in Antarctica, scientists are studying the effects of climate change.

The scientists are particularly concerned about the speed at which Antarctic ice is melting as well as its impact on global sea levels.

The researchers are also studying a large colony of emperor penguins that lives near their facility. They are studying how these birds are adapting to climate change.

https://youtu.be/iLGgILUqbcc

Global Climate Risk Index Shows Disastrous Impacts of Climate Change

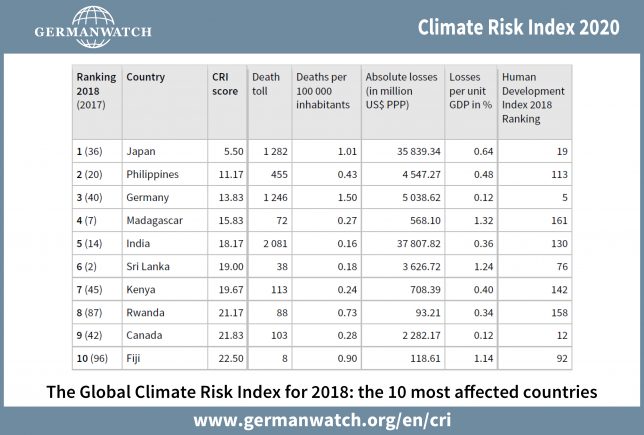
The Global Climate Risk Index by the environmental think tank Germanwatch shows that globally in the past 20 years, nearly 500,000 fatalities were directly linked to more than 12,000 extreme weather events. This amounted to approximately $3.54 trillion in economic damages.

The Climate Risk Index shows that climate change has disastrous impacts especially for poor countries, but also causes increasingly severe damages in industrialized countries like Japan or Germany.

–David Eckstein, Germanwatch
Climate Risk Index 2020, Table 2018 - 10 most affected countries
Climate Risk Index 2020, table 2018
(C) www.germanwatch.org/en/cri

Impact Especially Tough on Poor Countries

During 1999 to 2018, poor countries faced much higher impacts. Seven of the ten countries most affected are developing countries with low or lower middle income per capita. Puerto Rico, Myanmar, and Haiti were most affected. The Philippines were hit by the most powerful typhoon recorded worldwide in 2018.

Countries like Haiti, Philippines and Pakistan are repeatedly hit by extreme weather events and have no time to fully recover. That underlines the importance of reliable financial support mechanisms for poor countries like these not only in climate change adaptation, but also for dealing with climate-induced loss and damage.

–David Eckstein, Germanwatch

Those who are least responsible for the problem, are the ones who are suffering the most. This is unacceptable.

–Renato Redentor Constantino, Executive Director, Institute for Climate and Sustainable Cities (Philippines)

Industrialized Countries Also Impacted

Among industrialized countries, in 2018, Japan and Germany were hit hardest by heat-waves and severe drought.

Heat Waves

Science confirms the link between climate change and the frequency and severity of extreme heat.

Heat waves were one major cause of damage in 2018. Germany, Japan, and India suffered from extended periods of heat. Europe is now up to 100 times more likely than a century ago to experience extreme heat spells. The African continent heatwaves may be under-represented due to a lack of data.