With Davos starting up next week and COP28 wrapping up last month, we were curious to learn about significant climate change milestones, how our planet’s climate has evolved, and the lessons we can learn from this data.
Onset of Industrialization and its Impact
The Industrial Revolution marked a significant shift in climate change history. During the late 18th century, the widespread adoption of fossil fuels led to a notable increase in carbon dioxide (CO2) emissions, a key contributor to global warming. This period laid the foundation for the anthropogenic effects on climate that we witness today.
Discovery of the Greenhouse Effect
In the 19th century, scientists like John Tyndall and Svante Arrhenius began to unravel the role of greenhouse gases in regulating Earth’s temperature. This early research was pivotal in understanding how human activities could influence the climate through the emission of gases like CO2 and methane.
The Keeling Curve, a scientific project started by Charles David Keeling in 1958, provided the first clear evidence of rapidly increasing CO2 levels in the Earth’s atmosphere. It is a daily record of global atmospheric carbon dioxide concentration maintained by Scripps Institution of Oceanography at UC San Diego.
Intergovernmental Panel on Climate Change (IPCC)
Established in 1988 by the World Meteorological Organization (WMO) and the United Nations Environment Programme (UNEP), the IPCC plays a crucial role in assessing the science related to climate change. The panel provides scientific reports, key resources for governments and policymakers worldwide to help them understand climate change’s impacts and potential future risks, as well as strategies for adaptation and mitigation.
The inception of UN Climate Conferences (COP)
A landmark event in the history of global climate change initiatives was the inception of the United Nations Climate Change Conferences, commonly known as the Conference of the Parties (COP). The first COP meeting took place in 1995 in Berlin, Germany. The conference was convened in response to growing international concern over the alarming evidence of climate change and its potentially catastrophic impacts on the environment and human societies. The objective of these conferences was to review the implementation of the United Nations Framework Convention on Climate Change (UNFCCC), a treaty signed in 1992 by 154 nations at the Earth Summit in Rio de Janeiro. It aimed to combat dangerous human interference with the climate system. COP meetings have since become a central forum for nations to negotiate and assess progress in dealing with climate change.
World Economic Forum’s Engagement with Climate Change
The World Economic Forum (WEF) has played a pivotal role in bringing climate change to the forefront of global economic discussions. Initially focused on economic and business issues since its inception in 1971, the WEF began integrating environmental concerns, including climate change, into its agenda in the early 2000s. This integration marked a significant shift, recognizing the interdependence of economic development and environmental sustainability. The annual WEF meetings in Davos have since evolved to include a focus on climate change, sustainability, and green economic policies, bringing together leaders from various sectors to discuss and develop strategies to address these issues.
Global Climate Agreements and Policies
In response to growing evidence of climate change, international treaties like the Kyoto Protocol (1997) and the Paris Agreement (2015) were established. These agreements represent significant global efforts to reduce greenhouse gas emissions and mitigate climate change effects.
Grassroots Movements and Public Awareness
The rise of grassroots movements in the 21st century has been pivotal in driving public awareness and action on climate change. Notable examples include the “Fridays for Future” movement, inspired by activist Greta Thunberg, which mobilized millions of young people globally to demand climate action. These movements have been instrumental in pushing for urgent policy changes and raising awareness about the climate crisis at the community and global levels.
The Role of the Private Sector and Green Technology
The private sector’s shift towards sustainability and green technology represents a significant movement in addressing climate change. Companies around the world are increasingly adopting sustainable practices, investing in renewable energy, and innovating in green technology. This shift is not only a response to regulatory demands and environmental concerns but also a recognition of the economic opportunities in a low-carbon future.
Recent Trends and Extreme Weather Events
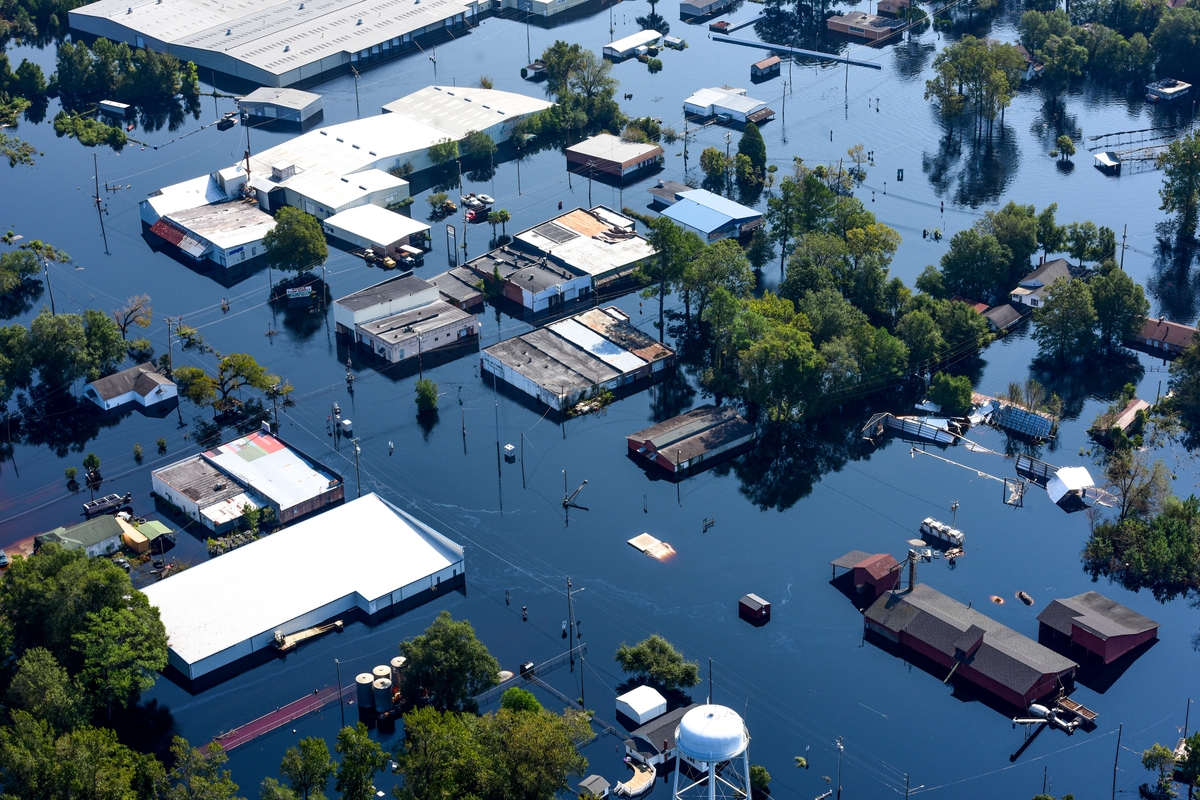
Last year, 2023, was confirmed to be warmest years on record, as confirmed by NASA and NOAA. Alongside rising temperatures, an increase in extreme weather events – such as hurricanes, droughts, and wildfires – has been observed, further indicating a changing climate.
2030 Agenda for Sustainable Development
Adopted by all United Nations Member States in 2015, the 2030 Agenda for Sustainable Development provides a shared blueprint for peace and prosperity for people and the planet. It includes 17 Sustainable Development Goals (SDGs), including climate action (Goal 13), afforable and clean energy (Goal 7), and responsible consumption and production (Goal 12). This agenda highlights the interconnected nature of social, economic, and environmental sustainability.
Historical climate change data is a window into the Earth’s climatic past and a guide for our future actions. It underscores the urgent need for informed policy decisions and collective action in addressing the challenges posed by climate change. Understanding and learning from our climate history remain an urgent priority in our journey towards a sustainable future.


